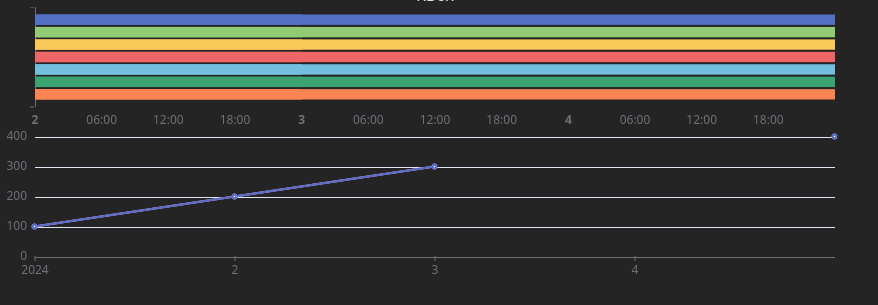
The other day at work I was working on a charting component for one of our pages, it had different assets and points where each assets contains multiple points and can be group in different ways. We had this massive iniative to replace our old charting component with ECharts due to performance issues.
While I was working on it, one of the requirements was I needed to be able to add/remove points from the graph. These points can either be a line chart or a horizontal bar chart. All horizontal bar needed to be at the top and all line chart had to be below the bar charts.
Requirements
- Should be able to handle charts getting added and removed
- Bar charts should be at the top of any line charts
- When all the bar charts are removed line chart should be at the top

I started with the very basic ECharts implementation passing in data to the dataset and building out all the necessary components (X-Axis, Y-Axis, Grid, and Series). Once I started adding charts dynamically in the grid, I started encountering this bizzare issue where all the previous charts were disappearing or axis were just getting rendered incorrectly.
I started looking into it a bit deeper and found notMerge option. notMerge is an option that basically tells ECharts to re-render the whole component, if there were incoming changes to the component (ie: new series B) this will recreate all the existing components (series A and B will get re-created).
This solved the issue of charts getting rendered out of order but the problem with using notMerge option since it loses the state of all the components, if you were using components like datazoom (inside) or custom tooltip then you lose the state of those. If you don’t use any of those components then setting notMerge is all you need.
In my scenario since I had to use dataZoom and a custom tooltip I had to find a different solution.
replaceMerge
The answer to my issue replaceMerge, replace merge is an option that I would say is not documented that well.
 The idea of replaceMerge is that it uses some sort of merge strategy to determine which component stays/merged or newly appended. Initially when I was work on the chart I was using indexes to match each components with each other and when I started using replaceMerge this caused the merge strategy to merge incorrectly.

I ended up having to redo the whole chart but this time setting all components with ids and still no luck.
Magic ingredient 🪄
replaceMerge to the rescue.
After trying different combinations of replaceMerge I finally found which combination I had to use.
replaceMerge: ["series", "xAxis", "yAxis", "grid"],
After setting the correct replaceMerge settings, it worked.
Code
Link to the github repository can be found here.
It uses react and two react echarts library in case you use one of them, otherwise it also works using vanilla js.